A
Accrual: The apportionment of premiums and discounts on forward exchange transactions that relate directly to deposit swap (Interest Arbitrage) deals, over the period of each deal.
Actualize: The underlying assets or instruments which are traded in the cash market.
Adjustable Peg: Term for an exchange rate regime where a country's exchange rate is "pegged" (i.e. fixed) in relation to another currency, often the dollar or French Franc, but where the rate may be changed from time to time. This was the basis of the Bretton Woods system. See peg, and crawling peg.
Adjustment: Official action normally by either change in the internal economic policies to correct a payment imbalance or in the official currency rate or.
Agent Bank: (1) A bank acting for a foreign bank. (2) In the Euro market - the agent bank is the one appointed by the other banks in the syndicate to handle the administration of the loan.
Aggregate Demand: Total demand for goods and services in the economy. It includes private and public sector demand for goods and services within the country and the demand of consumers and and firms in other countries for good and services.
Aggregate Risk: Size of exposure of a bank to a single customer for both spot and forward contracts.
Aggregate Supply: Total supply of goods and services in the economy from domestic sources (including imports) available to meet aggregate demand.
Agio: Difference in the value between currencies. Also used to describe percentage charges for conversion from paper money into cash, or from a weak into a strong currency.
Appreciation: Describes a currency strengthening in response to market demand rather than by official action.
Arbitrage: The simultaneous purchase and sale on different markets, of the same or equivalent financial instruments to profit from price or currency differentials. The exchange rate differential or Swap points. May be derived from Deposit Rate differentials.
Arbitrage Channel: The range of prices within which there will be no possibility to arbitrage between the cash and futures market.
Around: Used in quoting forward "premium / discount". "Five-five around" would mean five point on either side of the present spot value.
Asset Allocation: Dividing instrument funds among markets to achieve diversification or maximum return.
Ask: The price at which the currency or instrument is offered.
Asset: In the context of foreign exchange is the right to receive from a counterparty an amount of currency either in respect of a balance sheet asset (e.g. a loan) or at a specified future date in respect of an unmatched forward Forward or spot deal.
At Best: An instruction given to a dealer to buy or sell at the best rate that can be obtained.
At or Better: An order to deal at a specific rate or better.
Authorized Dealer: A financial institution or bank authorized to deal in foreign exchange.
B
Back Office: Settlement and related processes.
Backwardation: Term referring to the amount that the spot price exceeds the forward price.
Balance of Payments: A systematic record of the economic transactions during a given period for a country. (1) The term is often used to mean either: (i) balance of payments on "current account"; or (ii) the current account plus certain long term capital movements. (2) The combination of the trade balance, current balance, capital account and invisible balance, which together make up the balance of payments total. Prolonged balance of payment deficits tend to lead to restrictions in capital transfers, and or decline in currency values.
Band: The range in which a currency is permitted to move. A system used in the ERM.
Bank Line: Line of credit granted by a bank to a customer, also known as a "line".
Bank Rate: The rate at which a central bank is prepared to lend money to its domestic banking system.
Base Currency: The currency in which the operating results of the bank or institution are reported.
Basis: The difference between the cash price and futures price.
Basis Point: One per cent of one per cent.
Basis Trading: Taking opposite positions in the cash and futures market with the intention of profiting from favorable movements in the basis.
Basket: A group of currencies normally used to manage the exchange rate of a currency. Sometimes referred to as a unit of account.
Bear Market: A prolonged period of generally falling prices.
Bear: An investor who believes that prices are going to fall.
Bid: The price at which a buyer has offered to purchase the currency or instrument.
Book: The summary of currency positions held by a dealer, desk, or room. A total of the assets and liabilities. If the average maturity of the book is less than that of the assets, the bank is said to be running a short and open book. Passing the Book refers normally to transferring the trading of the Banks positions to another office at the close of the day, e.g. from London to New York.
Bretton Woods: The site of the conference which in 1944 led to the establishment of the post war foreign exchange system that remained intact until the early 1970s. The conference resulted in the formation of the IMF. The system fixed currencies in a fixed exchange rate system with 1% fluctuations of the currency to gold or the dollar.
Broker: An agent, who executes orders to buy and sell currencies and related instruments either for a commission or on a spread. Brokers are agents working on commission and not principals or agents acting on their own account. In the foreign exchange market brokers tend to act as intermediaries between banks bringing buyers and sellers together for a commission paid by the initiator or by both parties. There are four or five major global brokers operating through subsidiaries affiliates and partners in many countries.
Bull Market: A prolonged period of generally rising prices.
Bull: An investor who believes that prices are going to rise.
Bundesbank: Central Bank of Germany.
Buying Rate: Rate at which the market and a market maker in particular is willing to buy the currency. Sometimes called bid rate.
C
Cable: A term used in the foreign exchange market for the US Dollar / British Pound rate.
Capital Risk: The risk arising from a bank having to pay to the counter party with out knowing whether the other party will or is able to meet its side of the bargain. see Herstatt.
Carry: The interest cost of financing securities or other financial instruments held.
Cash Delivery: Same day settlement.
Cash Market: The market in the actual financial instrument on which a futures or options contract is based.
Cash: Cash normally refers to an exchange transaction contracted for settlement on the day the deal is struck. This term is mainly used in the North American markets and those countries which rely for foreign exchange services on these markets because of time zone preference i.e. Latin America. In Europe and Asia, cash transactions are often referred to as value same day deals.
Cash and Carry: The buying of an asset today and selling a future contract on the asset. A reverse cash and carry is possible by selling an asset and buying a future.
Cash Settlement: A procedure for settling futures contract where the cash difference between the future and the market price is paid instead of physical delivery.
Central Bank: A bank which is responsible for controlling a countries monetary policy. It is normally the issuing bank and controls bank licensing, and any foreign exchange control regime.
Central Rate: Exchange rates against the ECU adopted for each currency within the EMS. Currencies have limited movement from the central rate according to the relevant band.
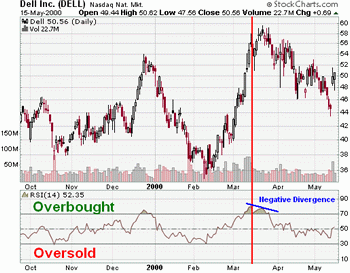
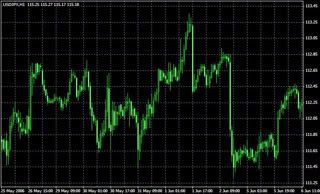
Chartist: An individual who studies graphs and charts of historic data to find trends and predict trend reversals which include the observance of certain patterns and characteristics of the charts to derive resistance levels, head and shoulders patterns, and double bottom or double top patterns which are thought to indicate trend reversals.
Clean Float: An exchange rate that is not materially effected by official intervention.
Closed Position: A transaction which leaves the trade with a zero net commitment to the market with respect to a particular currency.
Commission: The fee that a broker may charge clients for dealing on their behalf.
Confirmation: A memorandum to the other party describing all the relevant details of the transaction.
Contract: An agreement to buy or sell a specified amount of a particular currency or option for a specified month in the future (See Futures contract).
Conversion Account: A general ledger account representing the uncovered position in a particular currency. Such accounts are referred to as Position Accounts.
Conversion: The process by which an asset or liability denominated in one currency is exchanged for an asset or liability denominated in another currency.
Conversion Arbitrage: A transaction where the asset is purchased and buys a put option and sells a call option on the asset purchased, each option having the same exercise price and expiry.
Convertible Currency: A currency that can be freely exchanged for another currency (and or gold) without special authorization from the central bank.
Copey: Slang for the Danish krone.
Correspondent Bank: The foreign banks representative who regularly performs services for a bank which has no branch in the relevant centre, e.g. to facilitate the transfer of funds. In the US this often occurs domestically due to inter state banking restrictions.
Counterparty: The other organisation or party with whom the exchange deal is being transacted.
Countervalue: Where a person buys a currency against the dollar it is the dollar value of the transaction.
Country Risk: The risk attached to a borrower by virtue of its location in a particular country. This involves examination of economic, political and geographical factors. Various organisations generate country risk tables.
Cover: (1) To take out a forward foreign exchange contract. (2) To close out a short position by buying currency or securities which have been sold.
Covered Arbitrage: Arbitrage between financial instruments denominated in different currencies, using forward cover to eliminate exchange risk.
Covered Margin: The interest rate margin between two instruments denominated in different currencies after taking account of the cost of forward cover.
Crawling Peg: A method of exchange rate adjustment; the rate is fixed / pegged, but adjusted at certain intervals in line with certain economic or market indicators.
Credit Risk: The risk that a debtor will not repay; more specifically the risk that the counterparty does not have the currency promised to be delivered.
Cross Deal: A foreign exchange deal entered into involving two currencies, neither of which is the base currency.
Cross Rates: Rates between two currencies, neither of which is the US Dollar.
Current Account: The net balance of a country's international payment arising from exports and imports together with unilateral transfers such as aid and migrant remittances. It excludes capital flows.
D
Day Trader: Speculators who take positions in commodities which are then liquidated prior to the close of the same trading day.
Deal Date: The date on which a transaction is agreed upon.
Deal Ticket: The primary method of recording the basic information relating to a transaction.
Dealer: An individual or firm acting as a principal, rather than as an agent, in the purchase and / or sale of securities. Dealers trade for their own account and risk.
Deflator: Difference between real and nominal Gross National Product, which is equivalent to the overall inflation rate.
Delivery Date: The date of maturity of the contract, when the exchange of the currencies is made This date is more commonly known as the value date in the FX or Money markets.
Delivery Risk: A term to describe when a counterparty will not be able to complete his side of the deal, although willing to do so.
Depreciation: A fall in the value of a currency due to market forces rather than due to official action.
Desk: Term referring to a group dealing with a specific currency or currencies.
Details: All the information required to finalize a foreign exchange transaction, i.e. name, rate, dates, and point of delivery.
Devaluation: Deliberate downward adjustment of a currency against its fixed parities or bands, normally by formal announcement.
Direct Quotation: Quoting in fixed units of foreign currency against variable amounts of the domestic currency.
Dirty Float: Floating a currency when the rate is controlled by intervention by the monetary authorities.
E
Easing: Modest decline in price.
Economic Indicator: A statistics which indicates current economic growth rates and trends such as retail sales and employment.
ECU: European Currency Unit.
EDI: Electronic Data Interchange.
Effective Exchange Rate: An attempt to summarize the effects on a country's trade balance of its currency's changes against other currencies.
EFT: Electronic Fund Transfer.
EMS: European Monetary System.
European Monetary System: A system designed to stabilize if not eliminate exchange risk between member states of the EMS as part of the economic convergence policy of the EU. It permits currencies to move in a measured fashion (divergence indicator) within agreed bands (the parity grid) with respect to the ECU and consequently with each other.
Exchange Control: A system of controlling inflows and out flows of foreign exchange, devices include licensing multiple currencies, quotas, auctions, limits, levies and surcharges.
Exotic: A less broadly traded currency.
Exposure: (i) Net working capital - The current assets in a foreign currency minus current liabilities in the currency; (ii) Net financial method The current assets in a foreign currency minus current liabilities and long term debt in the currency; (iii) Monetary / non-monetary method - Monetary assets and liabilities in the foreign currency are valued at present exchange rates, while non-monetary items are entered at the relevant historic rates.
F
Fast Market: Rapid movement in a market caused by strong interest by buyers and / or sellers. In such circumstances price levels may be omitted and bid and offer quotations may occur too rapidly to be fully reported.
Fed Fund Rate: The interest rate on Fed funds. This is a closely watched short term interest rate as it signals the Feds view as to the state of the money supply.
Fed: The United States Federal Reserve. Federal Deposit Insurance Corporation Membership is compulsory for Federal Reserve members. The corporation had deep involvement in the Savings and Loans crisis of the late 80s.
Federal Reserve System: The central banking system of the US comprising 12 Federal Reserve Banks controlling 12 districts under the Federal Reserve Board. Membership of the Fed is compulsory for banks chartered by the Comptroller of Currency and optional for state chartered banks.
Fill or Kill: An order which must be entered for trading, normally in a pit three times, if not filled is immediately canceled.
Fisher Effect: The relationship that exists between interest rates and exchange rate movements, so that in an ideal situation interest rate differentials would be exactly off set by exchange rate movements. See interest rate parity.
Fixed Exchange Rate: Official rate set by monetary authorities. Often the fixed exchange rate permits fluctuation within a band.
Flexible Exchange Rate: Exchange rates with a fixed parity against one or more currencies with frequent revaluation's. A form of managed float.
Floating Exchange Rate: An exchange rate where the value is determined by market forces. Even floating currencies are subject to intervention by the monetary authorities. When such activity is frequent the float is known as a dirty float.
FOMC: Federal Open Market Committee, the committee that sets money supply targets in the US which tend to be implemented through Fed Fund interest rates etc.
Foreign Exchange: The purchase or sale of a currency against sale or purchase of another.
Forex: Foreign Exchange.
Forex Club: Groups formed in the major financial centers to encourage educational and social contacts between foreign exchange dealers, under the umbrella of Association Cambiste International.
Forward Margins: Discounts or premiums between spot rate and the forward rate for a currency. Normally quoted in points.
Forward Operations: Foreign exchange transactions, on which the fulfillment of the mutual delivery obligations is made on a date later than the second business day after the transaction was concluded.
Forward Outright: A commitment to buy or sell a currency for delivery on a specified future date or period. The price is quoted as the Spot rate minus or plus the forward points for the chosen period.
Forward Rate: Forward rates are quoted in terms of forward points, which represents the difference between the forward and spot rates. In order to obtain the forward rate from the actual exchange rate the forward points are either added or subtracted from the exchange rate. The decision to subtract or add points is determined by the differential between the deposit rates for both currencies concerned in the transaction. The base currency with the higher interest rate is said to be at a discount to the lower interest rate quoted currency in the forward market. Therefor the forward points are subtracted from the spot rate. Similarly, the lower interest rate base currency is said to be at a premium, and the forward points are added to the spot rate to obtain the forward rate.
Free Reserves: Total reserves held by a bank less the reserves required by the authority.
Front Office: The activities carried out by the dealer, normal trading activities.
Fundamentals: The macro economic factors that are accepted as forming the foundation for the relative value of a currency, these include inflation, growth, trade balance, government deficit, and interest rates.
FX: Foreign Exchange.
G
G7: The seven leading industrial countries, being US, Germany, Japan, France, UK, Canada, Italy.
G10: G7 plus Belgium, Netherlands and Sweden, a group associated with IMF discussions. Switzerland is sometimes peripherally involved.
Gap: A mismatch between maturities and cash flows in a bank or individual dealers position book. Gap exposure is effectively interest rate exposure.
Going Long: The purchase of a stock, commodity, or currency for investment or speculation.
Going Short: The selling of a currency or instrument not owned by the seller.
Gold Standard: The original system for supporting the value of currency issued. The was that where the price of gold is fixed against the currency it means that the increased supply of gold does not lower the price of gold but causes prices to increase.
Good Until Canceled: An instruction to a broker that unlike normal practice the order does not expire at the end of the trading day, although normally terminates at the end of the trading month.
Grid: Fixed margin within which exchange rates are allowed to fluctuate.
Gross Domestic Product: Total value of a country's output, income or expenditure produced within the country's physical borders.
Gross National Product: Gross domestic product plus "factor income from abroad" - income earned from investment or work abroad.
H
Hard Currency: A currency whose value is expected to remain stable or increase in terms of other currencies.
Head and Shoulders: A pattern in price trends which chartist consider indicates a price trend reversal. The price has risen for some time, at the peak of the left shoulder, profit taking has caused the price to drop or level. The price then rises steeply again to the head before more profit taking causes the the price to drop to around the same level as the shoulder. A further modest rise or level will indicate a that a further major fall is imminent. The breach of the neckline is the indication to sell.
Hedge: The purchase or sale of options or futures contracts as a temporary substitute for a transaction to be made at a later date. Usually it involves opposite positions in the cash or futures or options market.
Hit the Bid: Acceptance of purchasing at the offer or selling at the bid.
I
IMF: International Monetary Fund, established in 1946 to provide international liquidity on a short and medium term and encourage liberalization of exchange rates. The IMF supports countries with balance of payments problems with the provision of loans.
IMM: International Monetary Market part of the Chicago Mercantile Exchange that lists a number of currency and financial futures Implied volatilityA measurement of the market's expected price range of the underlying currency futures based on the traded option premiums.
Implied Rates: The interest rate determined by calculating the difference between spot and forward rates.
Indicative Quote: A market-maker's price which is not firm.
Inflation: Continued rise in the general price level in conjunction with a related drop in purchasing power. Sometimes referred to as an excessive movement in such price levels.
Initial Margin: The margin required by a Foreign Exchange firm to initiate the buying or selling of a determined amount of currency.
Inter-Bank Rates: The bid and offer rates at which international banks place deposits with each other. The basis of the Interbank market.
Interest Arbitrage: Switching into another currency by buying spot and selling forward, and investing proceeds in order to obtain a higher interest yield. Interest arbitrage can be inward, i.e. from foreign currency into the local one or outward, i.e. from the local currency to the foreign one. Sometimes better results can be obtained by not selling the forward interest amount. In that case some treat it as no longer being a complete arbitrage, as if the exchange rate moved against the arbitrageur, the profit on the transaction may create a loss.
Interest Parity: One currency is in interest parity with another when the difference in the interest rates is equalized by the forward exchange margins. For instance, if the operative interest rate in Japan is 3% and in the UK 6%, a forward premium of 3% for the Japanese Yen against sterling would bring about interest parity.
Interest Rate Swaps: An agreement to swap interest rate exposures from floating to fixed or vice versa. There is no swap of the principal. It is the interest cash flows be they payments or receipts that are exchanged.
Internationalization: Referring to a currency that is widely used to denominate trade and credit transactions by non residents of the country of issue. US dollar and Swiss Franc are examples.
Intervention: Action by a central bank to effect the value of its currency by entering the market. Concerted intervention refers to action by a number of central banks to control exchange rates.
K
Kiwi: Slang for the New Zealand dollar.
L
Leading Indicators: Statistic that are considered to precede changes in economic growth rates and total business activity, e.g. factory orders.
Liability: In terms of foreign exchange, the obligation to deliver to a counterparty an amount of currency either in respect of a balance sheet holding at a specified future date or in respect of an un-matured forward or spot transaction.
Limit Order: An order to buy or sell a specified amount of a currency at a specified price or better.
Liquidation: Any transaction that offsets or closes out a previously established position.
Liquidity: The ability of a market to accept large transactions.
M
Maintenance Margin: The minimum margin which an investor must keep on deposit in a margin account at all times in respect of each open contract.
Make a Market: A dealer is said to make a market when he or she quotes bid and offer prices at which he or she stands ready to buy and sell.
Managed Float: When the monetary authorities intervene regularly in the market to stabilize the rates or to aim the exchange rate in a required direction.
Margin Call: A demand for additional funds to be deposited in a margin account to meet margin requirements because of adverse future price movements.
Margin: For currencies a deposit made to the forex firm on establishing a futures position account.
Mark to Market: The daily adjustment of an account to reflect accrued profits and losses often required to calculate variations of margins.
Market Maker: A market maker is a person or firm authorized to create and maintain a market in an instrument.
Market Order: An order to buy or sell a financial instrument immediately at the best possible price.
Micro Economics: The study of economic activity as it applies to individual firms or well defined small groups of individuals or economic sectors.
Mid-Price or Middle Rate: The price half-way between the two prices, or the average of both buying and selling prices offered by the market makers.
Minimum Price Fluctuation: The smallest increment of market price movement possible in a given futures contract.
Monetary Base: Currency in circulation plus banks' required and excess deposits at the central bank.
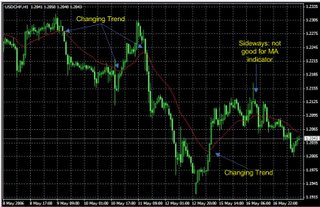
Moving Average: A way of smoothing a set of data, widely used in price time series.
N
Net Position: The amount of currency bought or sold which have not yet been offset by opposite transactions.
O
Odd Lot: A non standard amount for a transaction.
Offer: The price at which a seller is willing to sell. The best offer is the lowest such price available.
Offset: The closing-out or liquidation of a futures position.
Off-shore: The operations of a financial institution which although physically located in a country, has little connection with that country's financial systems. In certain countries a bank is not permitted to do business in the domestic market but only with other foreign banks. This is known as an off shore banking unit.
Overnight Limit: Net long or short position in one or more currencies that a dealer can carry over into the next dealing day. Passing the book to other bank dealing rooms in the next trading time zone reduces the need for dealers to maintain these unmonitored exposures.
Overnight: A deal from today until the next business day.
P
Parity: (1) Foreign exchange dealer's slang for your price is the correct market price. (2) Official rates in terms of SDR or other pegging currency.
Parities: The value of one currency in terms of another.
Pegged: A system where a currency moves in line with another currency, some pegs are strict while others have bands of movement.
Pip: Minimum fluctuation or smallest increment of price movement.
Position: The netted total commitments in a given currency. A position can be either flat or square (no exposure), long, (more currency bought than sold), or short (more currency sold than bought).
Profit Taking: The unwinding of a position to realize profits.
Q
Quote: An indicative price. The price quoted for information purposes but not to deal.
R
Rally: A recovery in price after a period of decline.
Range: The difference between the highest and lowest price of a future recorded during a given trading session.
Rate: (1) The price of one currency in terms of another, normally against USD. (2) Assessment of the credit worthiness of an institution.
Reaction: A decline in prices following an advance.
Reciprocal Currency: A currency that is normally quoted as dollars per unit of currency rather than the normal quote method of units of currency per dollar. Sterling is the most common example.
Resistance Point or Level: A price recognized by technical analysts as a price which is likely to result in a rebound but if broken through is likely to result in a significant price movement.
Revaluation: Increase in the exchange rate of a currency as a result of official action.
Revaluation Rate: The rate for any period or currency which is used to revalue a position or book.
Risk Management: The identification and acceptance or offsetting of the risks threatening the profitability or existence of an organisation. With respect to foreign exchange involves among others consideration of market, sovereign, country, transfer, delivery, credit, and counterparty risk.
Risk Position: An asset or liability, which is exposed to fluctuations in value through changes in exchange rates or interest rates.
Rollover: An overnight swap, specifically the next business day against the following business day (also called Tomorrow Next, abbreviated to Tom-Next).
Round Trip: Buying and selling of a specified amount of currency.
S
Same Day Transaction: A transaction that matures on the day the transaction takes place.
Selling Rate: Rate at which a bank is willing to sell foreign currency.
Settlement Date: The date by which an executed order must be settled by the transference of instruments or currencies and funds between buyer and seller.
Settlement Risk: Risk associated with the non settlement of the transaction by the counter party.
Short Sale: The sale of a specified amount of currency not owned by the seller at the time of the trade. Short sales are usually made in expectation of a decline in the price.
Short-term Interest Rates: Normally the 90 day rate.
Sidelined: A major currency that is lightly traded due to major market interest being in another currency pair.
Soft Market: More potential sellers than buyers, which creates an environment where rapid price falls are likely.
Spot: (1) The most common foreign exchange transaction. (2) Spot or Spot date refers to the spot transaction value date that requires settlement within two business days, subject to value date calculation.
Spot Next: The overnight swap from the spot date to the next business day.
Spot Price / Rate: The price at which the currency is currently trading in the spot market.
Spread: (1) The difference between the bid and ask price of a currency. (2) The difference between the price of two related futures contracts.
Square: Purchase and sales are in balance and thus the dealer has no open position.
Squawk Box: A speaker connected to a phone often used in broker trading desks.
Squeeze: Action by a central bank to reduce supply in order to increase the price of money.
Stable Market: An active market which can absorb large sale or purchases of currency without major moves.
Standard: A term referring to certain normal amounts and maturities for dealing.
Sterilization: Central Bank activity in the domestic money market to reduce the impact on money supply of its intervention activities in the FX market.
Sterling: British pound, otherwise known as cable.
Stocky: Market slang for Swedish Krona.
Stop Loss Order: Order given to ensure that, should a currency weaken by a certain percentage, a short position will be covered even though this involves taking a loss. Realize profit orders are less common.
Support Levels: When an exchange rate depreciates or appreciates to a level where (1) Technical analysis techniques suggest that the currency will rebound, or not go below; (2) the monetary authorities intervene to stop any further down ward movement. See resistance point.
Swap Price: A price as a differential between two dates of the swap.
Swap: The simultaneous purchase and sale of the same amount of a given currency for two different dates, against the sale and purchase of another. A swap can be a swap against a forward. In essence, swapping is somewhat similar to borrowing one currency and lending another for the same period. However, any rate of return or cost of funds is expressed in the price differential between the two sides of the transaction.
Swissy: Market slang for Swiss Franc.
T
Technical Correction: An adjustment to price not based on market sentiment but technical factors such as volume and charting.
Thin Market: A market in which trading volume is low and in which consequently bid and ask quotes are wide and the liquidity of the instrument traded is low.
Thursday / Friday Dollars: A US foreign exchange technicality. If a foreign bank buys dollars on Tuesday for Thursday delivery. If the bank leaves the funds overnight and transfers them on Friday by means of a clearing house cheque then clearance is not until Monday, the next working day. Higher interest rates for this period are thus available.
Tick: A minimum change in price, up or down.
Today / Tomorrow: Simultaneous buying of a currency for delivery the following day and selling for the spot day, or vice versa. Also referred to as overnight.
Tomorrow Next (Tom Next): Simultaneous buying of a currency for delivery the following day and selling for the spot day or vice versa.
Trade Date: The date on which a trade occurs.
Tradeable Amount: Smallest transaction size acceptable.
Transaction Date: The date on which a trade occurs.
Transaction: The buying or selling of currencies resulting from the execution of an order.
Two Tier Market: A dual exchange rate system where normally only one rate is open to market pressure, e.g. South Africa.
Two-Way Quotation: When a dealer quotes both buying and selling rates for foreign exchange transactions.
U
Uncovered: Another term for an open position.
Under-Valuation: An exchange rate is normally considered to be undervalued when it is below its purchasing power parity.
Up Tick: A transaction executed at a price greater than the previous transaction.
V
Value Date: For a spot transaction it is two business banking days forward in the country of the bank providing quotations which determine the spot value date. The only exception to this general rule is the spot day in the quoting centre coinciding with a banking holiday in the country(ies) of the foreign currency(ies). The value date then moves forward a day.
Value Spot: Normally settlement for two working days from today. See value date.
Volatility: A measure of the amount by which an asset price is expected to fluctuate over a given period.
Vostro Account: A local currency account maintained with a bank by another bank. The term is normally applied to the counterparty's account from which funds may be paid into or withdrawn, as a result of a transaction.
W
Wash Trade: A matched deal which produces neither a gain nor a loss.
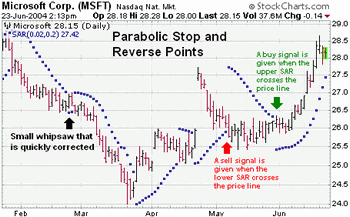
Whipsaw: Term for where a trader takes a position, then has to move against it triggering stop loss limits and liquidation of positions, then having to move in the original direction. Normally occurs in volatile markets.
Working Day: A day on which the banks in a currency's principal financial centre are open for business. For FX transactions, a working day only occurs if the bank in both financial centre's are open for business (all relevant currency centers in the case of a cross are open).


