


Short-Term Trendline
Have you ever heard of words saying “the trend is your friend”? Yup, everybody keeps saying that when they enter the market. Especially in forex which is running in 24 hours in every work day.
This article is discussing how short-term trend is being developed. First of all, let’s us know that “bullish” means upward trend and “bearish” means downward trend.
Bullish trend is occurred when series of market price that represented by candlesticks/bars on chart are showing upward movement.
And vice versa, bearish trend is occurred when series of market price that represented by candlesticks/bars on chart are showing downward movement.
And the next question is what are we going to do in bullish or bearish trend?
Since I trade by following the big trend, then I only buy in bullish trend and only sell in bearish trend. But this is not what swing traders do (let’s talk about this some other time).
Now, we’re going to determine bullish and bearish trend by drawing diagonal line on our chart.
Bullish Trend Line
Below is example of Usd/Jpy at 1H time scale. We will use 1H time scale to determine short-term trend.
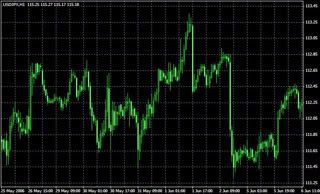
Now, let’s see on June 5 to June 6. We see that market price tends to move upward. Then we can draw upward diagonal line to represent bullish trend. Find lowest opening/closing prices at each candlestick. Then connect those opening/closing prices and make diagonal line like picture below.
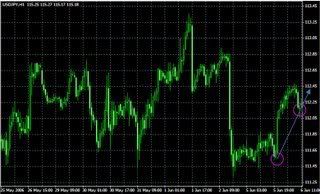
There you go. Now you have bullish trend line. And as long as price moved above bullish trend line, then market is considered to be bullish. And it is recommended to buy the pair just above the bullish trend line (but not too far above trend line).
Now we step forward. Let’s see what happen on the next days.
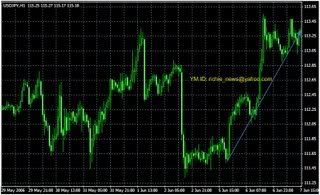
As we can see, most of the candlesticks are moving above our bullish trend line. So if we buy just above that line, then we might gain some profits there.
But when market price crosses below our bullish trend line (shown on chart at June 7), then it is time for us to wait and see. And expect the new trend to come.
Bearish Trend Line
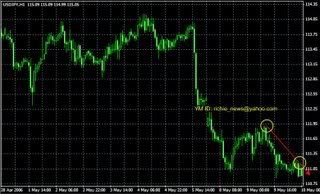
Below is example of Usd/Jpy at 1H time scale. We will use 1H time scale to determine short-term trend.
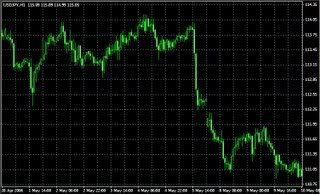
Now, let’s see on May 9. We see that market price tends to move downward. Then we can draw downward diagonal line to represent bearish trend. Find highest opening/closing prices at each candlestick. Then connect those opening/closing prices and make diagonal line like picture below.
There you go. Now you have bearish trend line. And as long as price moved below bearish trend line, then market is considered to be bearish. And it is recommended to sell the pair just below the bearish trend line (but not too far below trend line).
Now we step forward. Let’s see what happen on the next days.
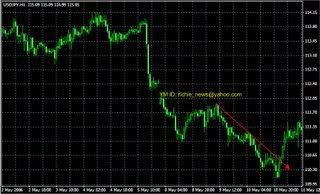
As we can see, most of the candlesticks are moving below our bearish trend line. So if we sell just below that line, then we might gain some profits there.
But when market price crosses above our bullish trend line (shown on chart at May 10), then it is time for us to wait and see. And expect the new trend to come.
This article is discussing how short-term trend is being developed. First of all, let’s us know that “bullish” means upward trend and “bearish” means downward trend.
Bullish trend is occurred when series of market price that represented by candlesticks/bars on chart are showing upward movement.
And vice versa, bearish trend is occurred when series of market price that represented by candlesticks/bars on chart are showing downward movement.
And the next question is what are we going to do in bullish or bearish trend?
Since I trade by following the big trend, then I only buy in bullish trend and only sell in bearish trend. But this is not what swing traders do (let’s talk about this some other time).
Now, we’re going to determine bullish and bearish trend by drawing diagonal line on our chart.
Bullish Trend Line
Below is example of Usd/Jpy at 1H time scale. We will use 1H time scale to determine short-term trend.
Now, let’s see on June 5 to June 6. We see that market price tends to move upward. Then we can draw upward diagonal line to represent bullish trend. Find lowest opening/closing prices at each candlestick. Then connect those opening/closing prices and make diagonal line like picture below.
There you go. Now you have bullish trend line. And as long as price moved above bullish trend line, then market is considered to be bullish. And it is recommended to buy the pair just above the bullish trend line (but not too far above trend line).
Now we step forward. Let’s see what happen on the next days.
As we can see, most of the candlesticks are moving above our bullish trend line. So if we buy just above that line, then we might gain some profits there.
But when market price crosses below our bullish trend line (shown on chart at June 7), then it is time for us to wait and see. And expect the new trend to come.
Bearish Trend Line
Below is example of Usd/Jpy at 1H time scale. We will use 1H time scale to determine short-term trend.
Now, let’s see on May 9. We see that market price tends to move downward. Then we can draw downward diagonal line to represent bearish trend. Find highest opening/closing prices at each candlestick. Then connect those opening/closing prices and make diagonal line like picture below.
There you go. Now you have bearish trend line. And as long as price moved below bearish trend line, then market is considered to be bearish. And it is recommended to sell the pair just below the bearish trend line (but not too far below trend line).
Now we step forward. Let’s see what happen on the next days.
As we can see, most of the candlesticks are moving below our bearish trend line. So if we sell just below that line, then we might gain some profits there.
But when market price crosses above our bullish trend line (shown on chart at May 10), then it is time for us to wait and see. And expect the new trend to come.
posted by admin | 1:45 AM
![]()
0 Comments:
Post a Comment
<< Home