


Forex Indicator - Moving Average (50)
Simple Moving Averages are one of the most popular and easy to use tools available to the technical analyst. They smooth a data series and make it easier to spot trends, something that is especially helpful in volatile markets.
Let’s discuss MA (50). ‘50’ means that the indicator uses 50 latest days to make its average. And I use 1H of time scale in implementing the indicator. The moving average represents the consensus of investor’s expectations over the indicated period of time. If the instrument price is above its moving average, it means that investor’s current expectations are higher than their average ones over the last 50 days, and that investors are becoming increasingly bullish on the instrument. Conversely, if today’s price is below its moving average, it shows that current expectations are below the average ones over the last 50 days.
The classic interpretation of a moving average is to use it in observing changes in prices. Investors typically buy when the price of an instrument rises above its moving average and sell when it falls below its moving average. That’s it!
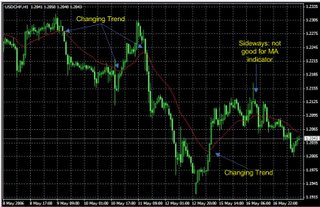
Take a look at the picture above. When market price crosses MA(50), it tells you that the trend will change. But unfortunately all moving averages are lagging indicators and will always be "behind" the price.
But however, I use MA(50) to help me indicating long term bullish trend and bearish trend. But please be very careful when you see sideways market like picture above. This is the weakness of using MA indicator.
posted by admin | 6:18 PM
![]()
0 Comments:
Post a Comment
<< Home